Role:
UX Researcher
Tools:
Lyssna, R Studio, Canva
Timeline:
April – June 2024
(8 weeks)
Research Question
This research aimed to explore whether greater implementation of community features by platforms and increased usage of these features by users, can influence user motivation in their physical activity level.
The setting
Strava
Since its founding in 2009, Strava has attracted over 100 million athletes from 190 countries[4], establishing itself as a leader in the market. Strava allows runners, cyclists, and athletes from various disciplines, including water sports, to record their activities using biometric and technical measurements, and share their trainings and experiences with the community. Currently, the running community is one of the platform’s largest segments.
Adidas Running
On the other side, Adidas Running in its current form, emerged after several iterations following Adidas’ acquisition of Runtastic, with its final design solidified in 2019.
Like Strava, Adidas Running enables users to track a wide range of sports, though running remains its core feature.
Preset and personalised training are available and results can be shared among users within the community.
Other apps were analyzed during the initial market research, but competitors like Nike Running seem to prioritize activity tracking features over community engagement making these less ideal for the predetermined research purpose.
The process
Explorative Interviews
To gain better insights into the users of Strava and Adidas Running, I conducted five semi-structured interviews.
Combined with the ones conducted by my colleagues, these interviews provided a good way to gain an initial understanding of the user base, the apps they use, and potential research directions.
Interview structure and questions
- Initial introduction and request for informed consent
- Demographics (Age, gender, nationality)
- How often do you run?
- What are your running goals?
- How do you track your progress?
- What makes you use/not use a running app?
- Tell me more, which features you retain more important for you in the app?
- How did you usually recorded your activities before using your current app, what was your experience?
- Other than your smartphone app, what other do you use to record your activities?
(Do you use any wearable devices? how come?) - How do you use the collected data?
(what do you think about using them to review and compare your past performances?) - How do you think tracking your activities can impact on you?
- Can you tell me more about strategies you use to stay motivated?
- What do you think about training with other people? how does it influence your experience?
- Final interviewee debriefing and conclusion
Based on the insights gained, we identified Strava and Adidas Running as the primary applications to focus on for our study. These apps were the most commonly mentioned and used by the participants we reached, making them ideal for a convenience sample study.
Additionally, the information gathered from the interviews informed the design of the questionnaire, which we used to collect user data for our subsequent quantitative analysis.
Other relevant observed aspects:
Some interviewees expressed discomfort with sharing their performance results due to fear of being judged by others.
However, others mentioned that comparing their previous results with current achievements provided motivation, as it highlighted their progress.
This contrast in attitudes toward result sharing and self-comparison emerged as an interesting area, prompting further exploration of this aspect in the questionnaire.
Questionnaire
The research was conducted using a between-subject design, as it was determined that finding users equally familiar with both apps would be challenging. This approach also helped reduce potential biases, such as the tendency to give higher ratings to the app participants were already using, which could result in choice-supportive bias.
To collect data relevant to our research, we used parts of two standardized questionnaires and supplemented them with had-hoc questions to gain deeper insights into users’ running habits and their feelings about the app community and social features. To maximize participant reach, the questionnaire was offered in both English and Italian.
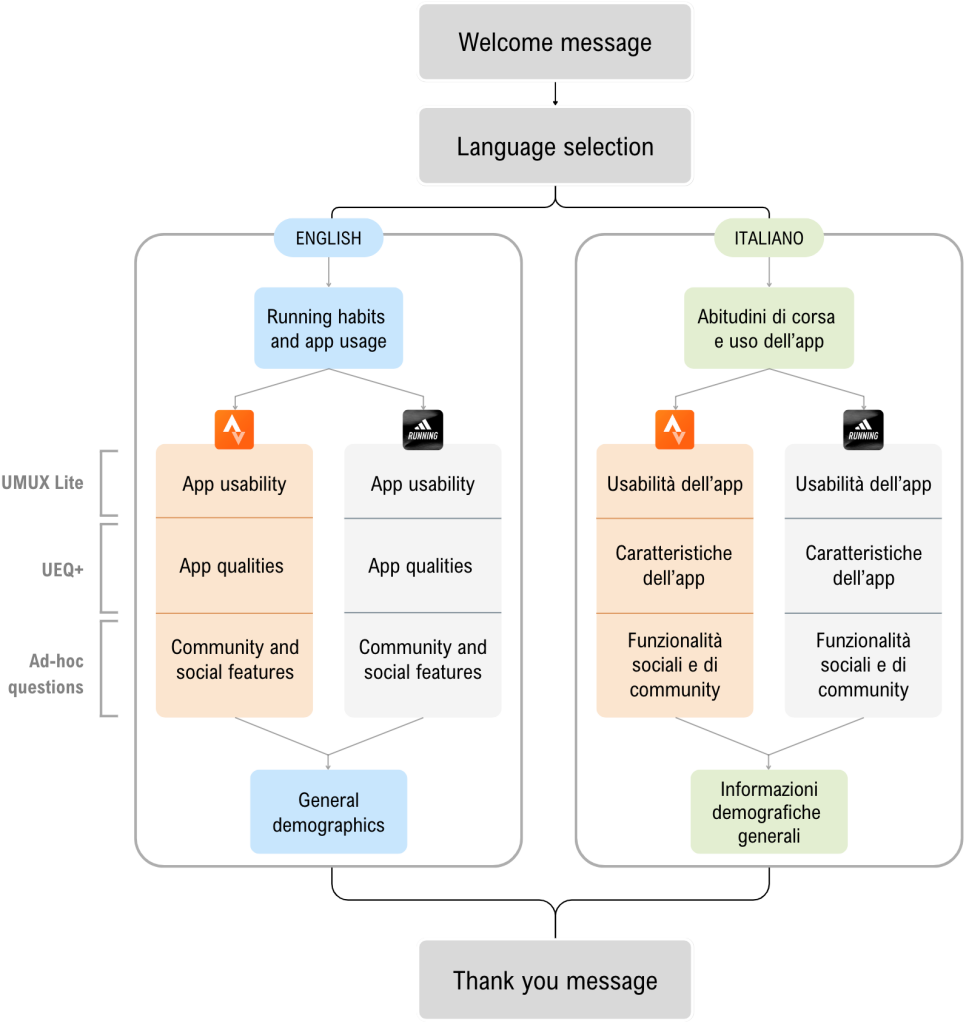
- UMUX Lite (Usability Metric for User Experience)[1]: A more condensed but equally effective alternative to the SUS (System Usability Scale), used to measure the overall usability of the system and assess the user experience
- UEQ+[3]: A customizable UX set of items designed to build a questionnaire tailored to the specific research objectives. We specifically measured dimensions such as usefulness, perspicuity, adaptability, attractiveness, social interaction, social stimulation, and social acceptance.
- Ad-Hoc questions: These were designed to explore participants’ feelings toward the social features of the app and their impact on well-being (e.g., anxiety, motivation, or indifference when comparing personal results with others or sharing their performance).
Data Gathering & Analysis
A total of 57 respondents participated in the study.
The majority of respondents were between 18 and 30 years old (M = 27,75), with a nearly equal gender distribution (27 male and 30 female participants). There was a slight prevalence of Italian respondents (38 Italians versus 19 non-Italians).
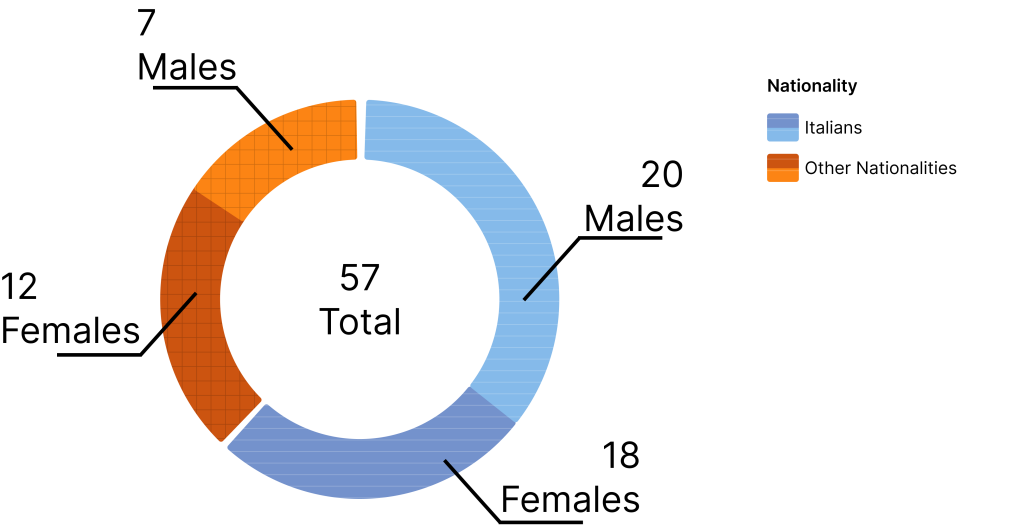
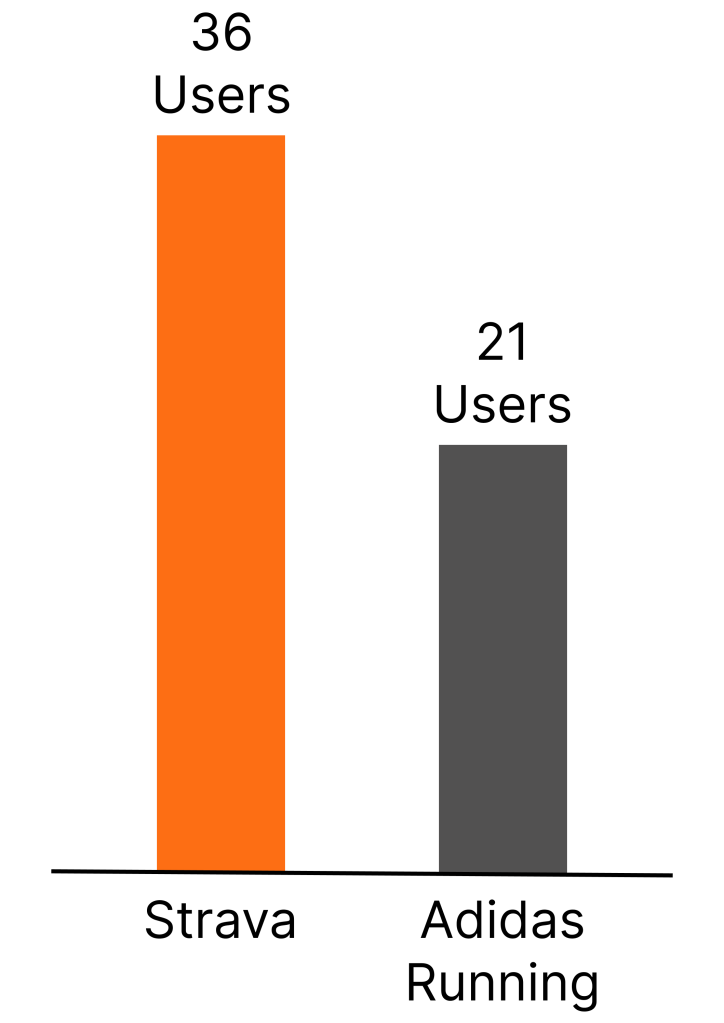
The distribution of users between the two apps was skewed as well, with 36 respondents using Strava and 21 using Adidas Running. To address this imbalance and ensure valid comparisons, we applied data transformations (e.g., square root or log transformations) to adjust for the skewed distribution and minimize any potential bias in the analysis.
Descriptive analysis
The majority of respondents reported using their respective app for over 3 years, suggesting that most participants were proficient with the app and familiar with its functionalities and features.
The most reported, liked and used features were:
Visualisation of route, distance, and pace.
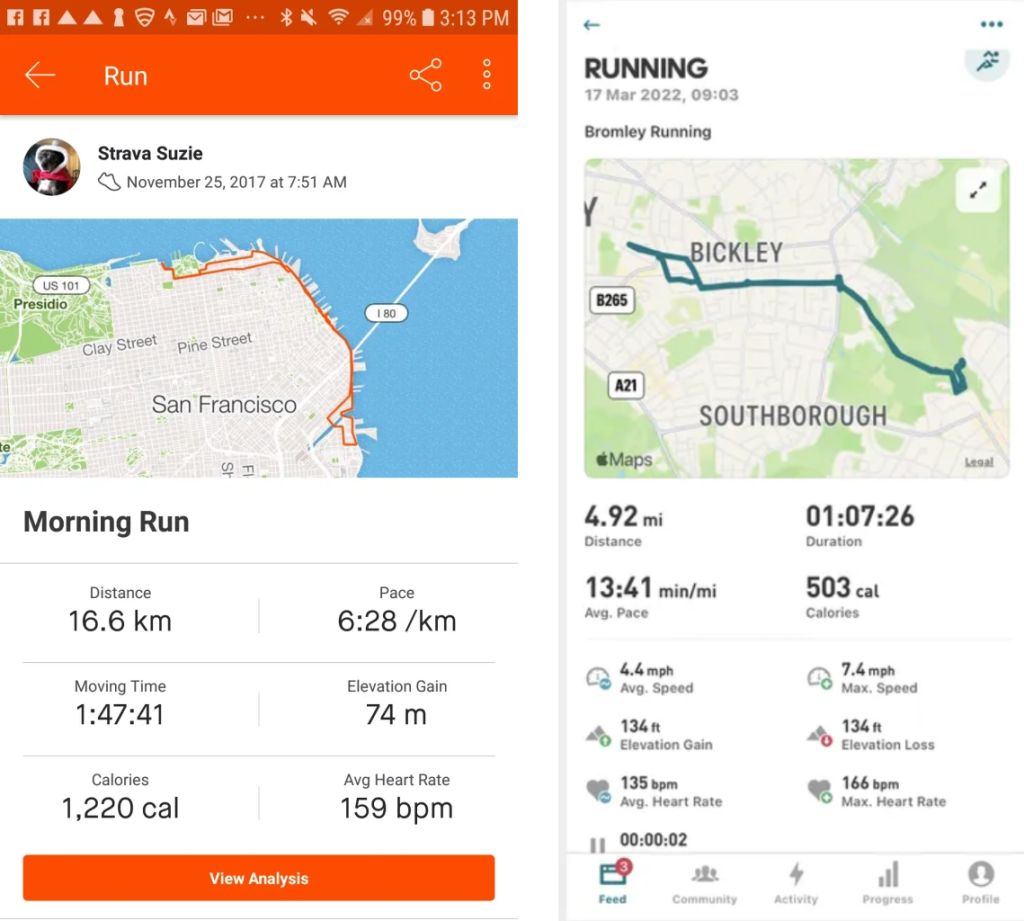
[Images Credits to: tomsguide.com]
- Visualisation of progress comparing previous results with present ones (i.e.: personal record, delta between km ran this month and last month, delta of pace)
- Rankings of running times for specific segments (i.e.: King of the Mountain in Strava)
However, a notable difference between the two apps emerged. Strava users expressed dissatisfaction with the limited features available in the free version of the app, especially when compared to Adidas Running users, who reported a more favourable range of free features.

Adidas Running appeared less exclusive and restrictive, even in its free-to-use version, making it more accessible for newcomers.
This approach may lowers the entry barrier and encourages broader usage.
In contrast, Strava seems to aim to create a more exclusive feeling for its user base, with limited features in the free version, which may discourage casual users or those unwilling to pay for a subscription.
This exclusivity may be seen to position Strava as an app geared toward more committed or competitive users who are ready to invest in premium features for a more advanced experience.
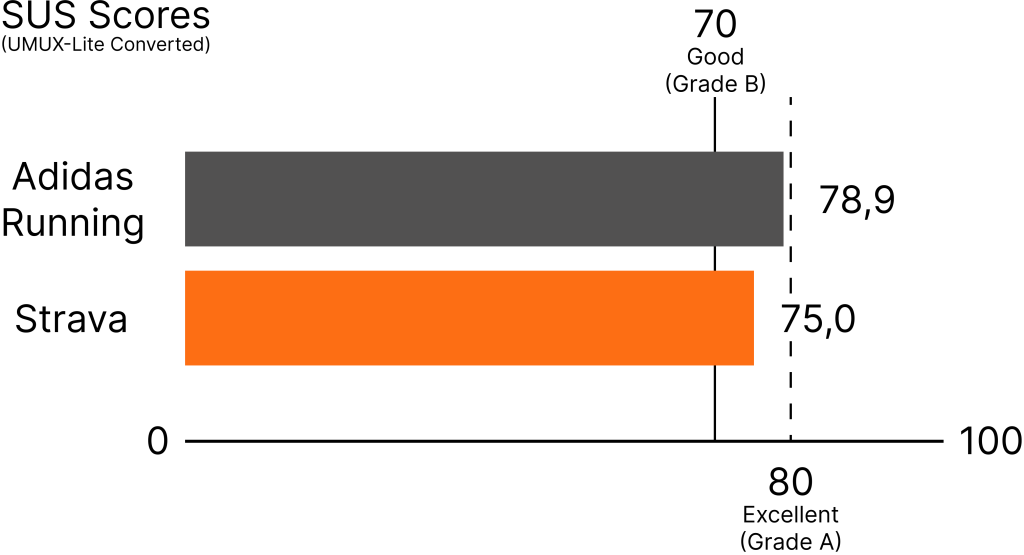
Both apps received positive usability scores based on the UMUX-Lite (then converted to the SUS), with both falling above the acceptability threshold.
Although Adidas Running scored slightly higher than Strava, both apps remained within the same scoring range.
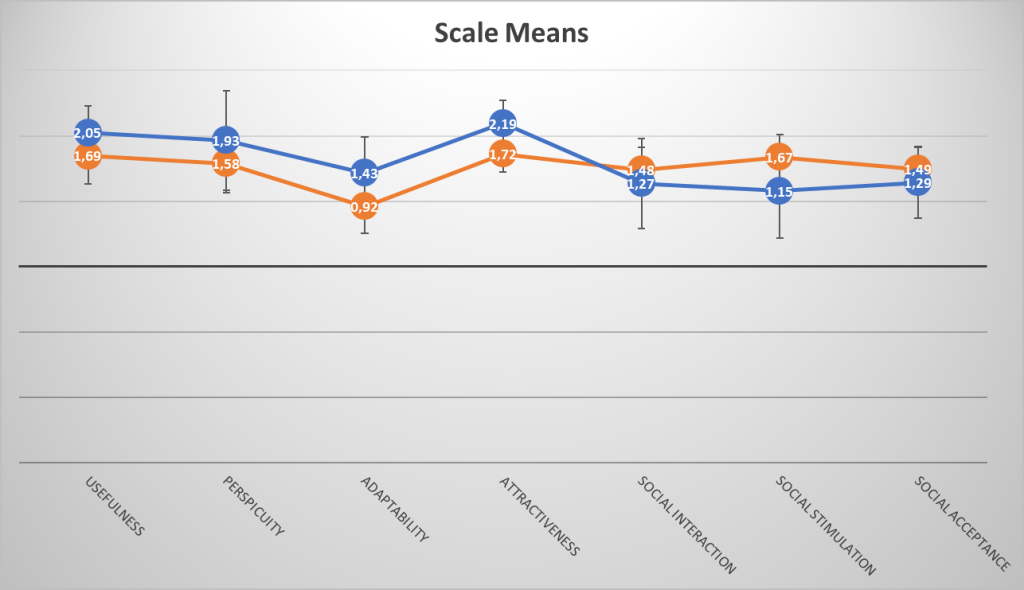
The UEQ+[2] results also provided valuable insights.
While both apps scored similarly across the seven measured dimensions, Adidas Running performed slightly better in the pragmatic items (usefulness, perspicuity, adaptability).
In contrast, Strava scored higher in the “Social Stimulation” item, potentially suggesting that Strava has a stronger impact on the social interaction of its users, reinforcing its identity as a community-driven app.
Inferential analysis
Using the ANOVA tests we analysed whether the app used by a perso, and the degree of social interaction they have within the app with others (i.e.: sharing training, commenting, giving kudos) could have an effect on the perception of the app’s pragmatic qualities, and correlate on the overall motivation to run of the user.
It was interesting to observe how the community aspect significantly influences our users’ perception of Attractiveness in Adidas Running compared to Strava, meaning that users who utilise the social aspects of Adidas Running perceive it as more attractive than those who do not. The same correlation was not found among Strava users.

We also found out how a greater use of community features by a user seems to significantly correlate to higher frequency in their workouts compared to users who use community features less (independently from the application of choice), which may suggest a motivation increase in the former.
Users who reported discomfort with sharing their records in the app were also the ones who interacted the least with the community features.
While avoiding these features may alleviate their uneasiness, this does not mean the solution they are adopting is the optimal one.
These users, in fact, might want to engage with the community as much as those already using the social features, but their discomfort acts as a barrier.
This could lead to dissatisfaction for these users and a missed opportunity for the app in terms of interaction and engagement, potentially negatively impacting overall user retention and community growth.
References
[1] James R. Lewis, Brian S. Utesch, and Deborah E. Maher. 2013. UMUX-LITE: when there’s no time for the SUS. In Proceedings of the SIGCHI Conference on Human Factors in Computing Systems, April 27, 2013. ACM, Paris France, 2099–2102. https://doi.org/10.1145/2470654.2481287
[2] Martin Schrepp and Jörg Thomaschewski. 2019. UEQ+ Data Analysis Tool. Retrieved June 17, 2024 from https://ueqplus.ueq-research.org/
[3] Martin Schrepp and Jörg Thomaschewski. UEQ+. UEQ+. Retrieved October 7, 2024 from https://ueqplus.ueq-research.org/
[4] Strava. Retrieved October 7, 2024 from https://press.strava.com/about